
Professional Services
Define Backlog, Time, Invoices, and Payments Before Building a Services Dashboard
A services dashboard needs agreement about what each number represents. Define the event, unit, date, and reporting grain before combining remaining work, approved hours, issued invoices, and recorded payments.
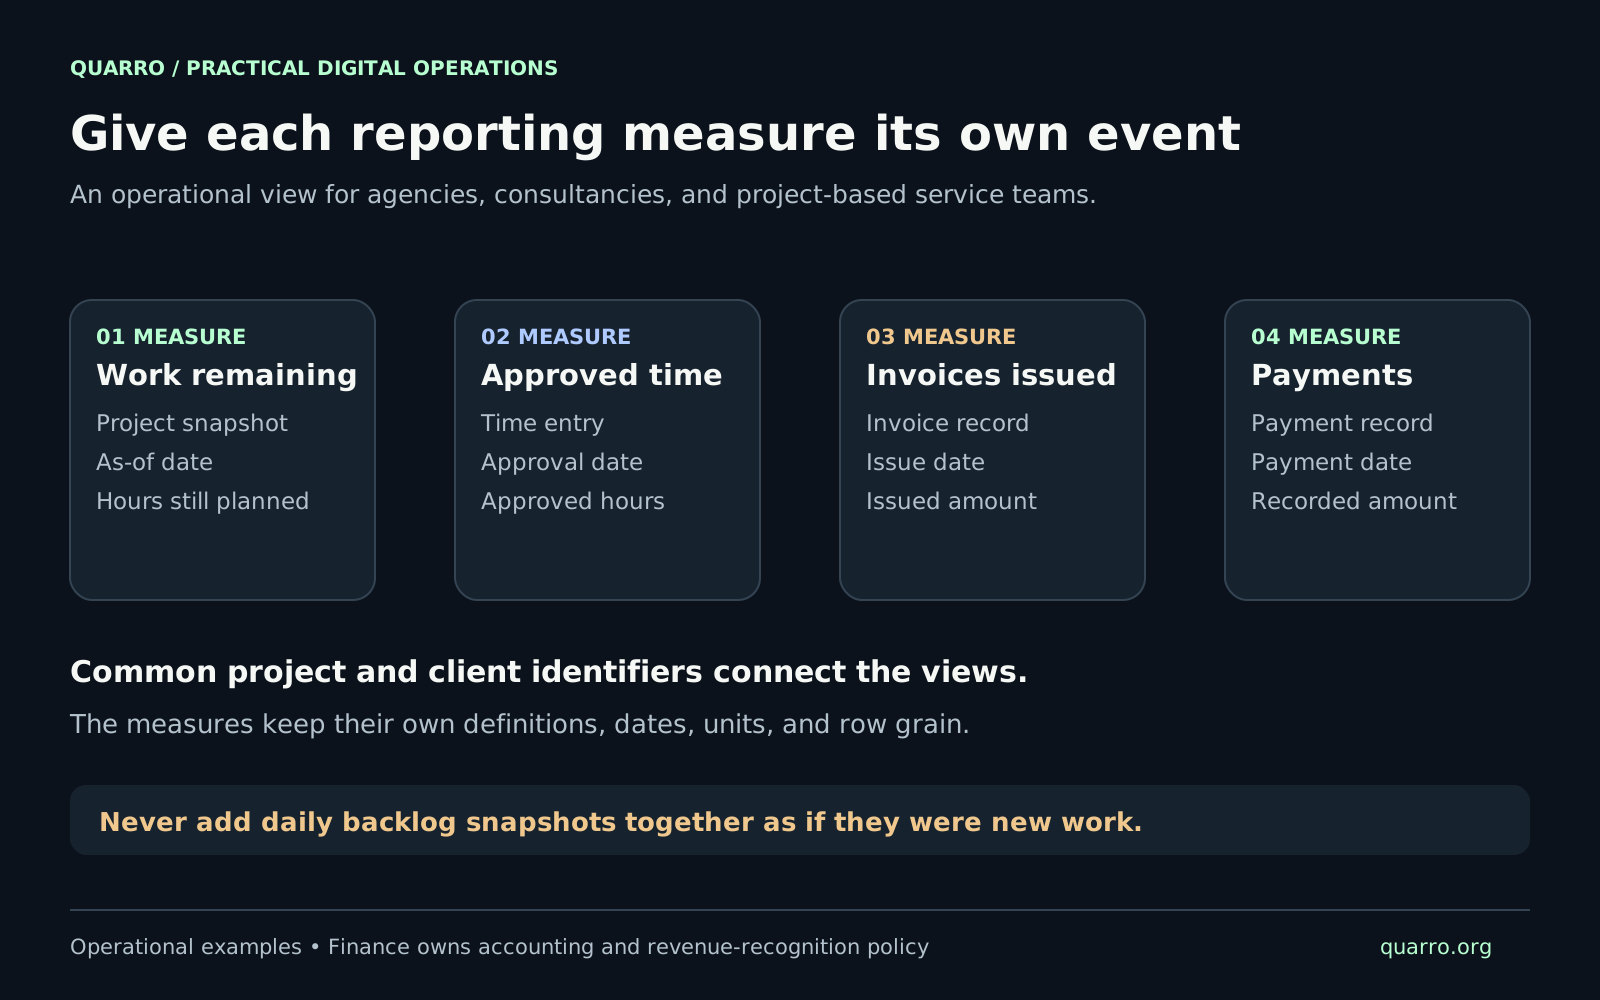
Begin with the decisions the team needs to make
Consider a hypothetical consultancy preparing its weekly operations meeting. Delivery wants to know which projects need capacity. Project leads want to see time awaiting review. Billing wants to identify issued invoices and recorded payments. Each question needs a different view of the same client relationships. Start by writing the decision beside each proposed measure. “Remaining planned hours by project” can inform a staffing discussion. “Hours approved this week” can help review an approval queue. Neither label should acquire a broader meaning simply because it appears on an executive dashboard. The framework below is a proposed operational design. Finance should approve any financial reporting definitions and own accounting and revenue-recognition policy.
Write a short definition for each measure
For every measure, record its name, purpose, unit, source, included states, excluded states, date basis, and owner. Specify how corrections work and what missing data looks like. Put a readable version of that definition within reach of the chart. For this example, define operational backlog as the latest approved estimate of hours still planned on active, authorized projects at a chosen point in time. Decide explicitly how paused work and unsigned proposals are treated. A separate pipeline view may be useful, but it needs its own definition. Define approved time as hours on eligible time entries with a verified approval event. Define invoices issued using the agreed issue date and eligible invoice states. Define payments logged using the recorded payment event and amount. Keep currencies visible and specify how taxes, credits, cancellations, and corrections are handled before publishing monetary totals.
Preserve the detail represented by each row
Choose a distinct record structure for each kind of observation: one project at one backlog snapshot, one time entry, one invoice, or one payment record. If the report needs invoice-line analysis or payment allocations, define those more detailed records explicitly and retain their parent identifiers. Microsoft's Power BI star-schema guidance recommends that fact tables maintain a consistent grain. In this dashboard, that means documenting exactly what one record represents before connecting the tables. Suppose a fictional invoice covers three time entries and receives two payments. Joining every time entry directly to every payment would produce six combinations. Repeating the invoice amount on each combination would inflate a careless sum. Keep the underlying measures separate, use stable project and client identifiers to connect relevant views, and test every total against its own source records.
Give the dates precise meanings
Work date, approval date, invoice issue date, payment date, and data refresh time should retain separate fields. A period filter needs to state which one it uses. Harvest's Time Entries API illustrates the distinction: it documents spent_date for the date of the work, approval_status for the current approval state, and updated_at for the latest update. Its listed attributes do not provide a dedicated approval-event timestamp. An implementation using that data alone should avoid claiming it knows when approval occurred. To support the illustration's approval-date view, capture a verified approval event through an appropriate source or workflow. Otherwise label the view as approved hours grouped by work date. Define how reopened entries and repeat approvals affect totals. Harvest also documents invoice issue_date separately from payment paid_date. Its payment records have creation timestamps as well. Preserve these distinctions when importing data rather than assigning every record the date it reached the dashboard.
Treat backlog as a point-in-time view
For the hypothetical consultancy, imagine 60 remaining planned hours on Monday and 48 on Tuesday. Adding those snapshots produces 108, which does not describe the remaining work on either day. Show the selected closing snapshot, a clearly labeled trend, or another explicitly defined calculation. Microsoft's Fabric fact-table guidance describes periodic snapshots and explains that their measures cannot simply be summed across time periods. Apply that principle to the proposed backlog view: select one valid snapshot per project for the reporting point before aggregating across projects. Also record why estimates changed. Completed work, newly authorized scope, revised estimates, and paused projects should be distinguishable where the source supports them. A falling backlog number alone cannot establish how much work the team completed.
Test the awkward records before trusting the overview
Build a small hypothetical test set with a late time approval, an edited estimate, a paused project, a cancelled invoice, a split payment, a missing project mapping, and a record arriving after the reporting cutoff. Write the expected outcome for each measure and reporting period. Check that excluded records remain inspectable rather than silently disappearing. An unmapped invoice should enter an exception list with its identifier and owner. A missing refresh should produce a visible freshness warning. If one source updated this morning and another last week, show those timestamps near the affected measures. Compare totals at several levels: individual records, a selected project, and the complete reporting period. Test filtering as well as unfiltered totals. A correct grand total can still hide a broken client or project relationship.
Publish the definitions with the dashboard
Release the dashboard with an owner for each measure, a definition version, source links available to authorized users, and an exception-handling process. When a definition changes, decide whether historical periods will be recalculated and explain the choice. A useful first version can be modest: four well-defined views, visible freshness, and a route from a number to its supporting records. At Quarro, we would use that foundation to help a services team discuss staffing, review, billing, and follow-up with fewer unresolved questions about what the numbers mean.