
Workflow improvement
Why sales dashboards disagree: orders, lines and shipments count different things
Two dashboards can disagree even when both use fresh data. One may count orders, another order lines, and another shipment events. Before replacing a chart or blaming the integration, write down what one row represents in each source and what the headline number is meant to measure. This is the dataset's grain: its level of detail.
The answer: agree what each row and measure represent
Two dashboards can disagree even when both use fresh data. One may count orders, another order lines, and another shipment events. Before replacing a chart or blaming the integration, write down what one row represents in each source and what the headline number is meant to measure. This is the dataset's grain: its level of detail.
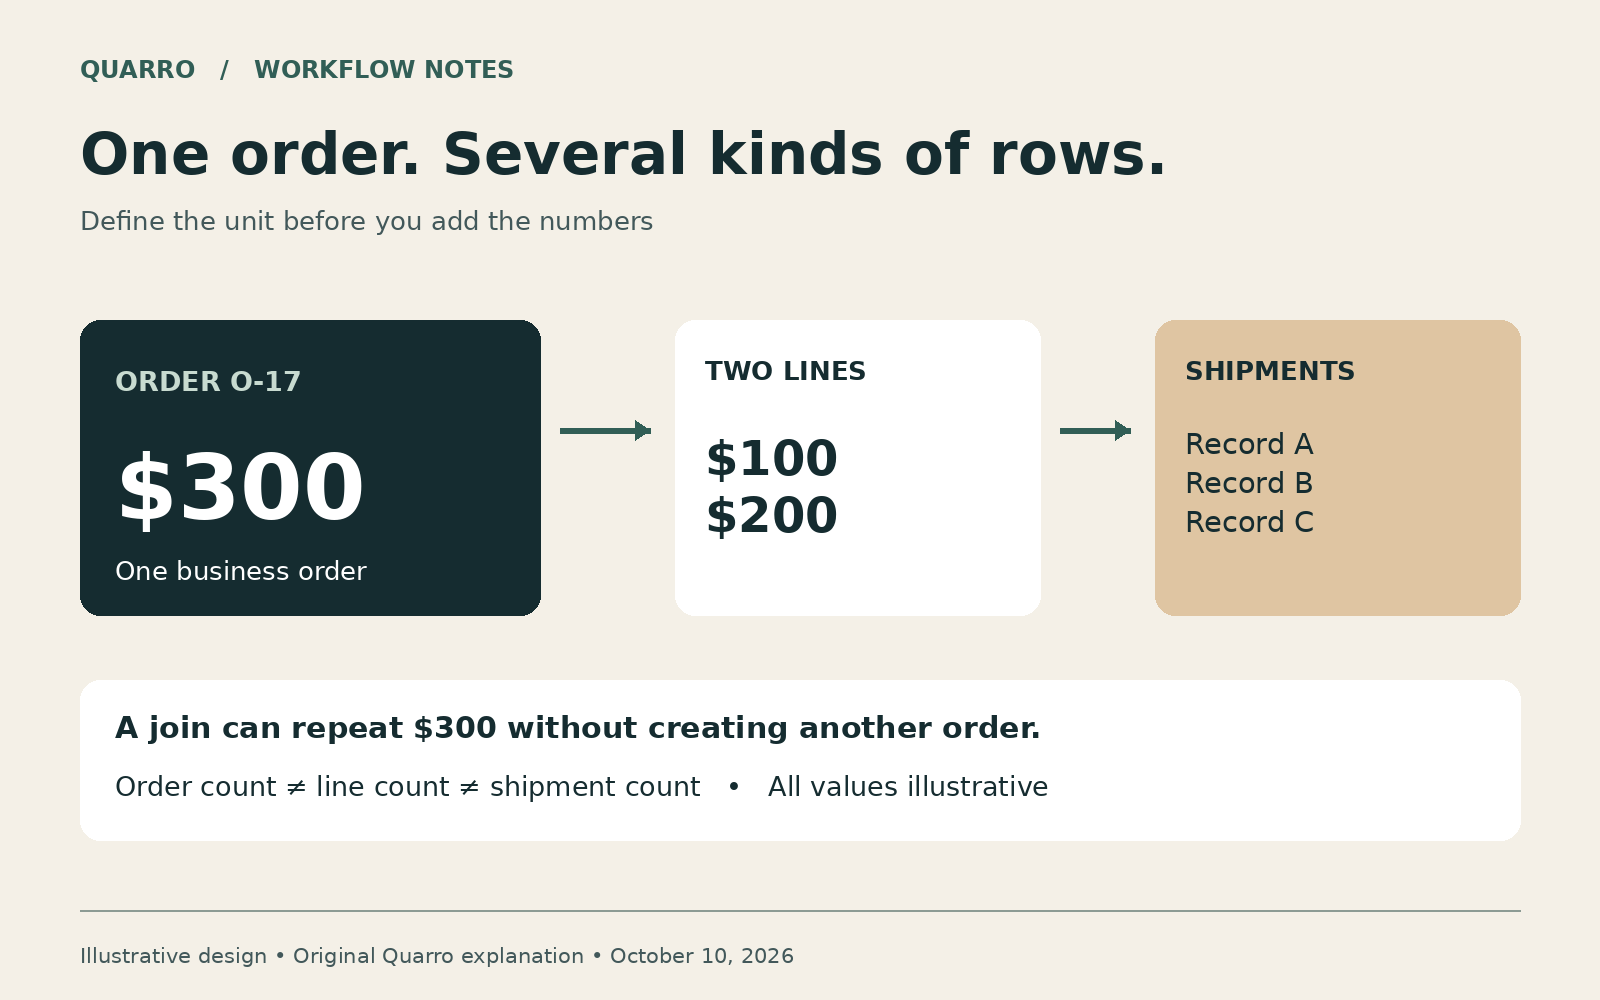
In an illustrative example, order O-17 is worth $300. It contains two line items worth $100 and $200 and is fulfilled across three shipment records. That is one order, two lines and three shipment records. A combined table can repeat order-level values across child records. Summing the repeated order total answers the wrong question.
The familiar shortcut and its limitation
A flat export is convenient because people can filter and inspect it in one place. Joining more operational tables seems like a natural way to enrich it. The risk appears when sources have different relationships: one order has many lines, and a line may have many shipment records. A join can create more rows without creating more business value.
Microsoft's star-schema guidance distinguishes fact and dimension tables and emphasizes a consistent grain for facts. The practical business lesson is simple: related information should not silently change the unit being counted. A more structured model can help, but it still needs an agreed definition of the metric.
Create a measure card before building the report
For each decision-driving number, record its name, purpose, unit, entity key, date basis, included states and aggregation rule. 'Sales' is not enough. Is it booked order value, shipped value, invoiced value or cash received? Do cancellations remove prior bookings or appear as a later adjustment? Does the date mean order creation, shipment or invoice issue? Those choices can legitimately produce different totals.
Give the card a business owner. An engineer can implement a rule and test it; the organization must decide what the number is intended to mean. Display a concise definition near the report and make the detailed rule available to reviewers.
Use a tiny reconciliation set
Choose fictional or permitted examples whose expected answers can be worked out manually: one normal order, one partial shipment, one cancellation and one return. Write the expected order count, line value and shipment count before running the report. Check them after every relationship or transformation change.
A distinct order count can repair a count inflated by a join. It does not automatically repair repeated monetary values, and summing distinct amounts is unsafe because separate orders can have equal totals. Keep measures at their proper grain and use explicit relationships or an appropriate pre-aggregation rather than a cosmetic deduplication.
When two numbers should remain different
Sometimes the reconciliation shows no defect. Sales needs bookings while operations needs shipped work. Keep both, label them accurately and explain the bridge between them. Forcing them to match can erase the very backlog or timing difference the business needs to understand.
A good acceptance test asks a reviewer to trace a headline value back to the underlying business events. If that explanation requires guessing which rows were counted, the model is not ready. Start with the definition and the small worked examples; add visual polish after the numbers have a stable meaning.