
Data and reporting
Operational dashboards need exception definitions before alerts
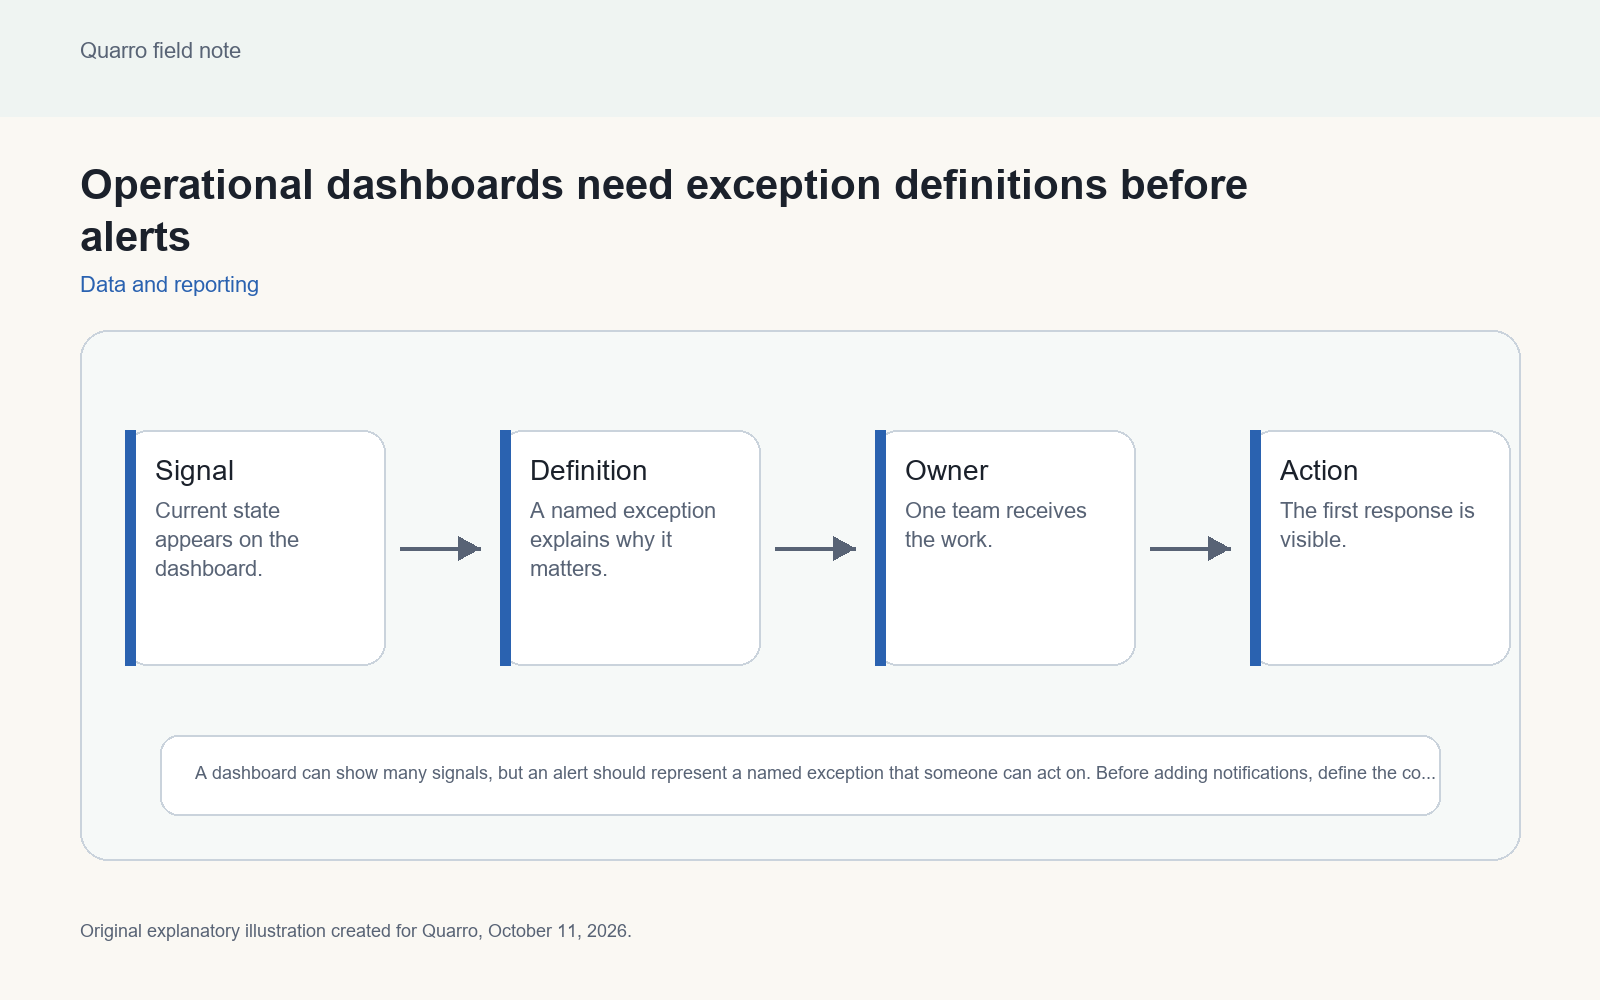
A dashboard can show many signals, but an alert should represent a named exception that someone can act on. Before adding notifications, define the condition, why it matters, who owns it, what evidence confirms it and what first action is expected.
The answer: name the exception before the alert
A dashboard can show many signals, but an alert should represent a named exception that someone can act on. Before adding notifications, define the condition, why it matters, who owns it, what evidence confirms it and what first action is expected. Without that definition, the alert is just a louder chart.
Imagine an operations dashboard with a red tile labeled Delayed. One team thinks it means a shipment is late against the promised date. Another thinks it means the warehouse has not scanned it yet. A third thinks the carrier missed pickup. All three may deserve attention, but they are not the same exception and they probably need different owners.
Separate status, risk and work queue
Dashboards often mix current state, predicted risk and pending work. A current state says what is true now. A risk signal says what might become a problem. A work queue says who should do something next. Blending them makes the screen look complete while hiding the decision model underneath.
Write a short exception contract for each alert candidate: source fields, refresh cadence, threshold, excluded cases, owner, escalation path and expected action. The excluded cases are not trivia. Planned maintenance, test data, held orders, known vendor outages and manually paused records can all create noise if the dashboard has no place for them.
Alert quality is a design requirement
Google SRE material frames alerting around significant events and discusses precision, recall, detection time and reset time. That vocabulary is helpful outside infrastructure too. A finance, fulfillment or support alert should also have enough precision that people trust it, enough recall that important exceptions are not missed, a detection time that matches the business risk and a reset behavior that does not keep shouting after the problem is handled.
This does not mean every dashboard needs SLO math. It means alert design should be evaluated, not guessed. If a red count routinely creates no action, either the definition is wrong, the owner is wrong or the screen is reporting a trend that belongs in review rather than interruption.
Make the first action visible
An operational alert should answer: what changed, which records are affected, why this is an exception, what is already known and what action is expected next. The action might be assign, inspect, retry, contact a supplier or mark as planned. If the only action is open another report and investigate from scratch, the alert is still upstream of the workflow.
Keep a history of alert state transitions. New, acknowledged, suppressed, resolved and false positive are different outcomes. Capturing them supports tuning and prevents the same unresolved exception from appearing new every time the dashboard refreshes.
Start with one painful exception
Choose one exception that already causes meetings, manual spreadsheet checks or late customer updates. Define it with real staff, implement the smallest reliable query, attach the affected records and review every alert for a short period. Count false positives and missed cases honestly. The first version should teach the organization what good looks like.
The practical takeaway: do not automate interruption until the exception is named. A dashboard can inform broadly, but an alert should enter a specific operational lane with a clear owner and a useful next step.